 [1] ".GlobalEnv"        "package:lubridate" "package:forcats"
 [4] "package:stringr"   "package:dplyr"     "package:purrr"
 [7] "package:readr"     "package:tidyr"     "package:tibble"
[10] "package:ggplot2"   "package:tidyverse" "package:stats"
[13] "package:graphics"  "package:grDevices" "package:utils"
[16] "package:datasets"  "package:methods"   "Autoloads"
[19] "package:base"
Lab 3: Basic Data Visualizations
Question
Insert a new code chunk into your Quarto document. In this code chunk, use the library() function to load the tidyverse package. On the next line in this code chunk, use the the search() function to print out a list of packages that have been loaded, and confirm that you see package:tidyverse in the output.
Question
Follow the instructions from Lab 1, and install the palmerpenguins package. If you are using the RStudio server, you can skip this step.
Then, insert a new code chunk into your Quarto document. In this code chunk, use the library() function to load the palmerpenguins package. On the next line in this code chunk, use the the search() function to print out a list of packages that have been loaded, and confirm that you see package:palmerpenguins in the output.
 [1] ".GlobalEnv"             "package:palmerpenguins" "package:lubridate"
 [4] "package:forcats"        "package:stringr"        "package:dplyr"
 [7] "package:purrr"          "package:readr"          "package:tidyr"
[10] "package:tibble"         "package:ggplot2"        "package:tidyverse"
[13] "package:stats"          "package:graphics"       "package:grDevices"
[16] "package:utils"          "package:datasets"       "package:methods"
[19] "Autoloads"              "package:base"
Question
Modify the code snippet above to create a histogram for the bill_length_mm variable.
Warning: Removed 2 rows containing non-finite outside the scale range
(`stat_bin()`).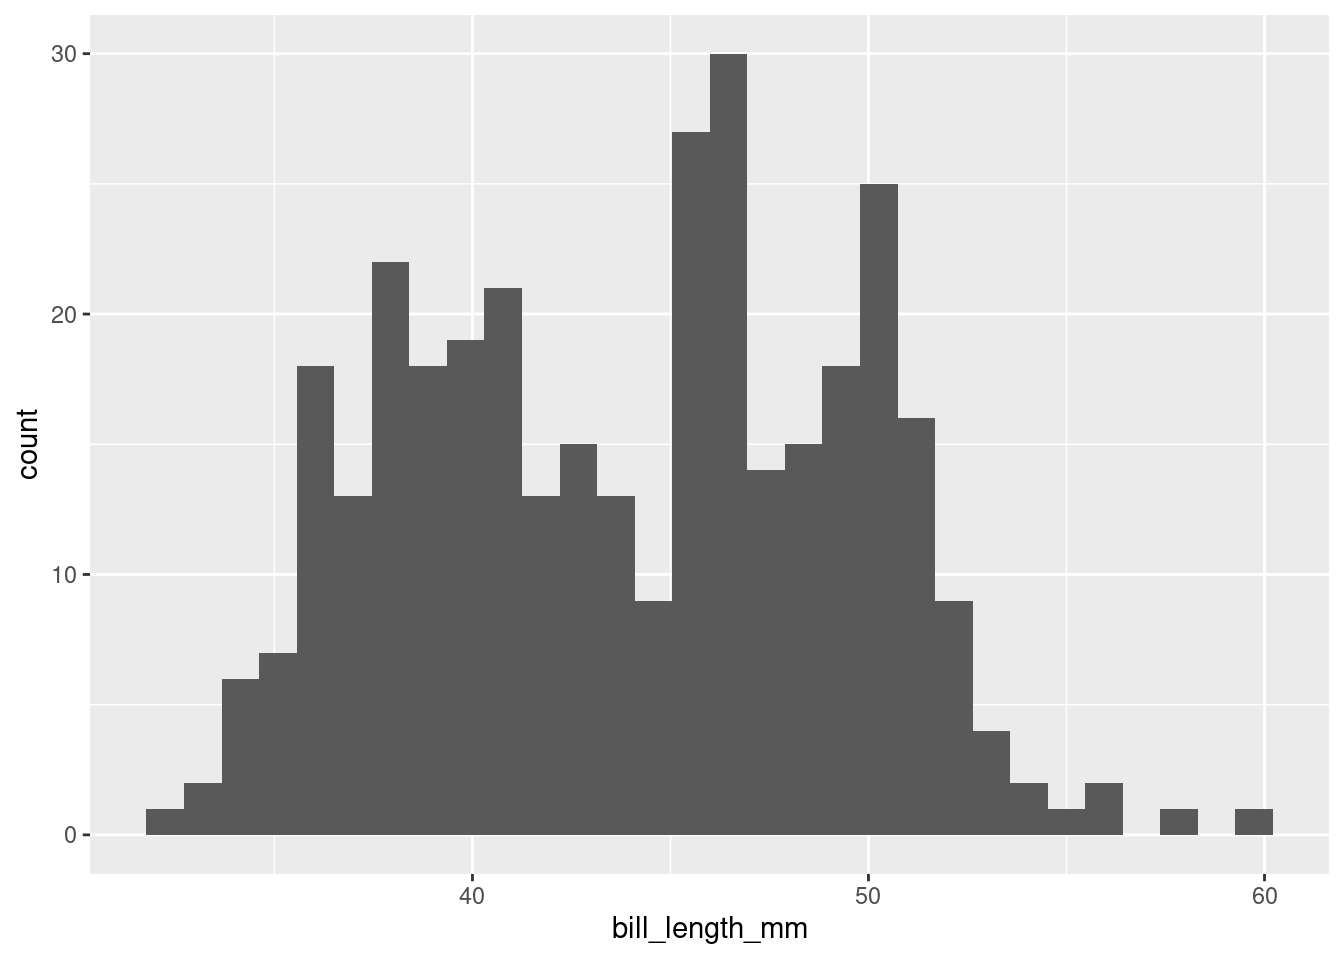
Question
Reproduce the box plot of flipper lengths shown above by coping the code for Figure 1, and changing the geom_histogram() function to the geom_boxplot() function.
Warning: Removed 2 rows containing non-finite outside the scale range
(`stat_boxplot()`).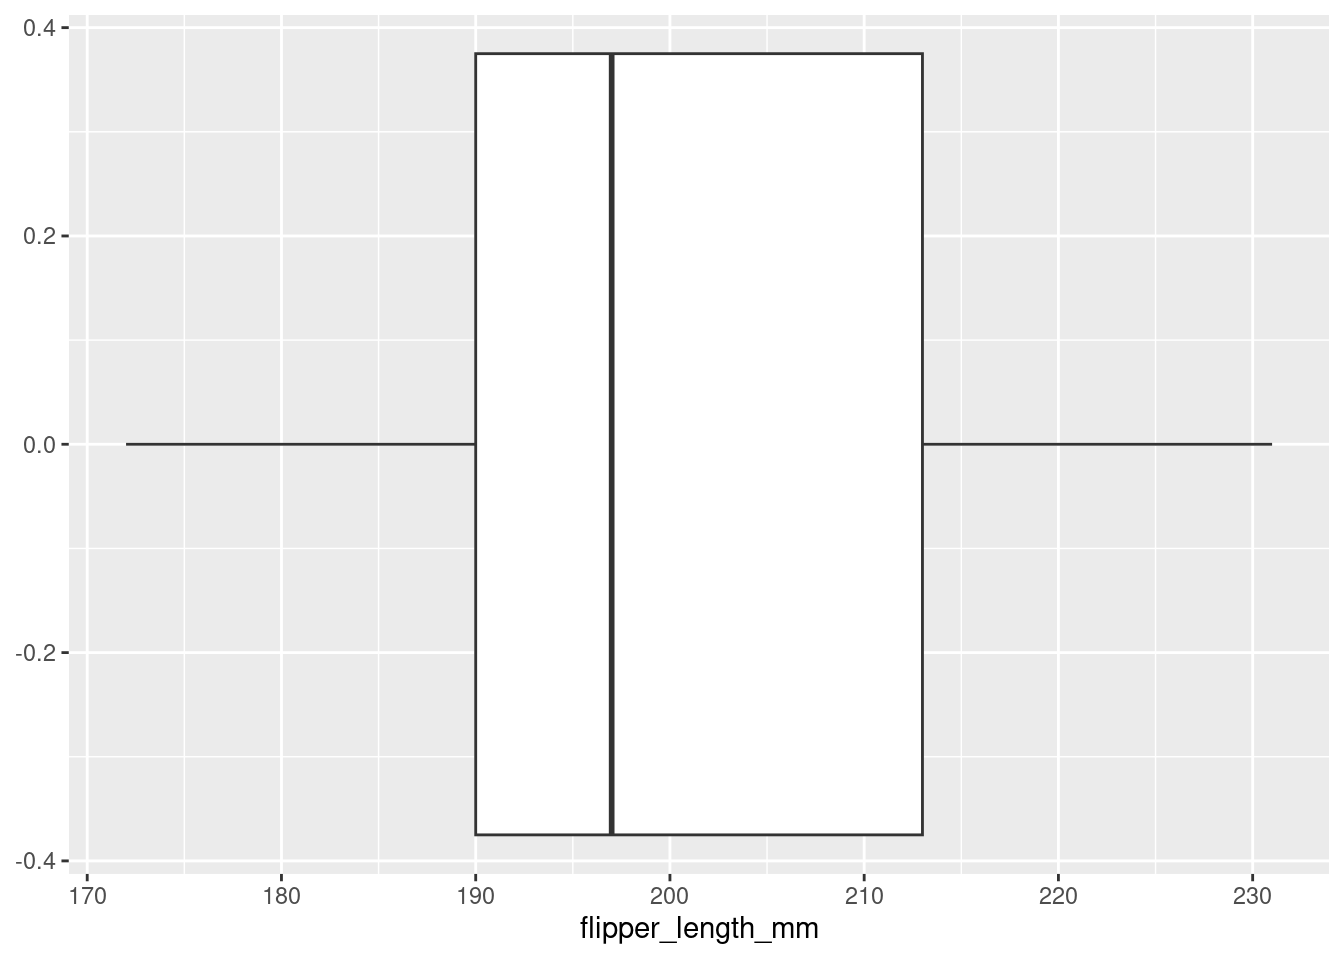
Question
Create a figure similar to Figure 3 that includes box plots showing the distribution of the bill_length_mm variable for penguins from each island. Make sure that each island is filled in with a different color, and make sure the bill lengths are measured along the vertical axis.
Warning: Removed 2 rows containing non-finite outside the scale range
(`stat_boxplot()`).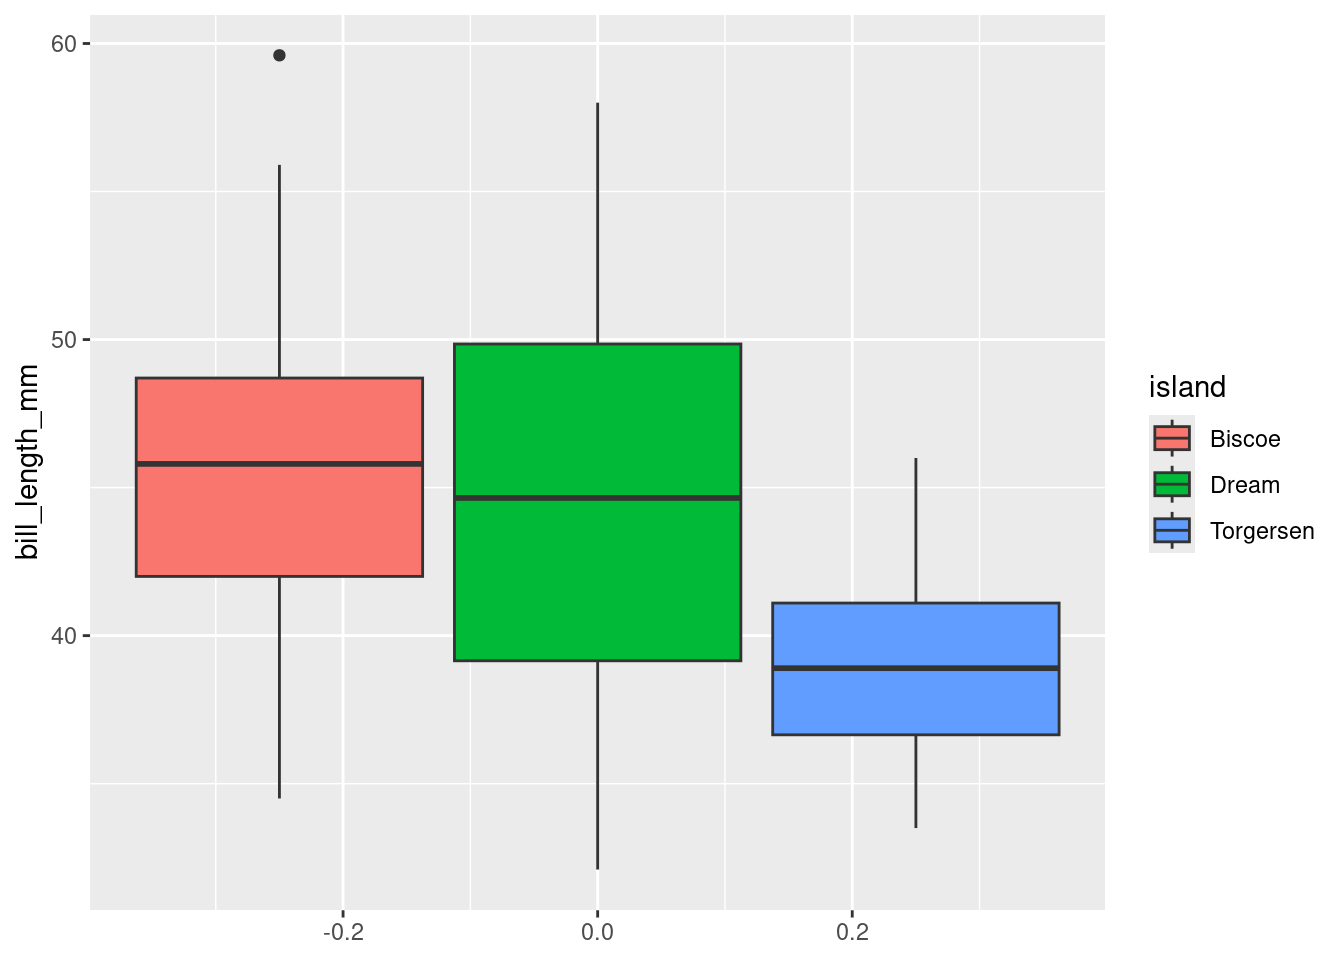
Question
Use faceting to create visualization that shows a histogram of the bill_length_mm distribution from each island. In this plot, arrange the three histograms horizontally (i.e., side-by-side); in other words, the plot should appear to have 3 columns.
Then answer the following questions:
- Which island seems to have penguins with the smallest bills?
- Which type of visualization do you prefer for comparing distributions? Faceted histograms (like the one you just created) or stacked box plot (like in Figure 3)?
Warning: Removed 2 rows containing non-finite outside the scale range
(`stat_bin()`).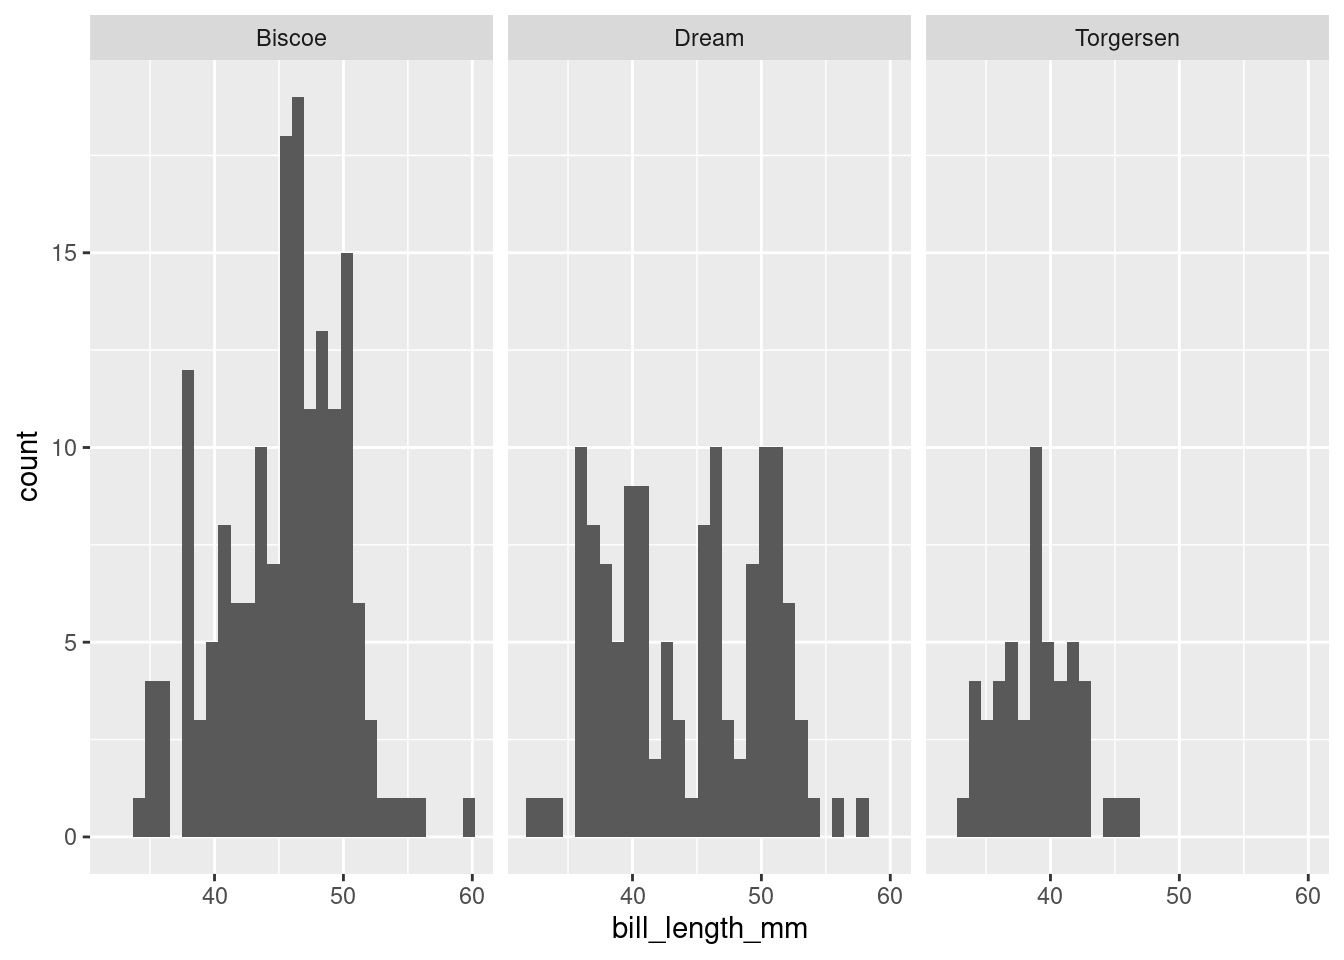
- Torgersen Island seems to have penguins with the smallest bills. On Biscoe and Dream islands, the majority of penguins have bills over 40 mm, but on Torgersen Island the majority of penguins have bills below 40 mm in length.
- There isn’t an objectively correct answer, but I prefer stacked boxplots. They are more compact and facilitate comparison of ‘big features’ better than histograms, which excel at showing more fine-grained patterns in the shape of the distribution.
Question
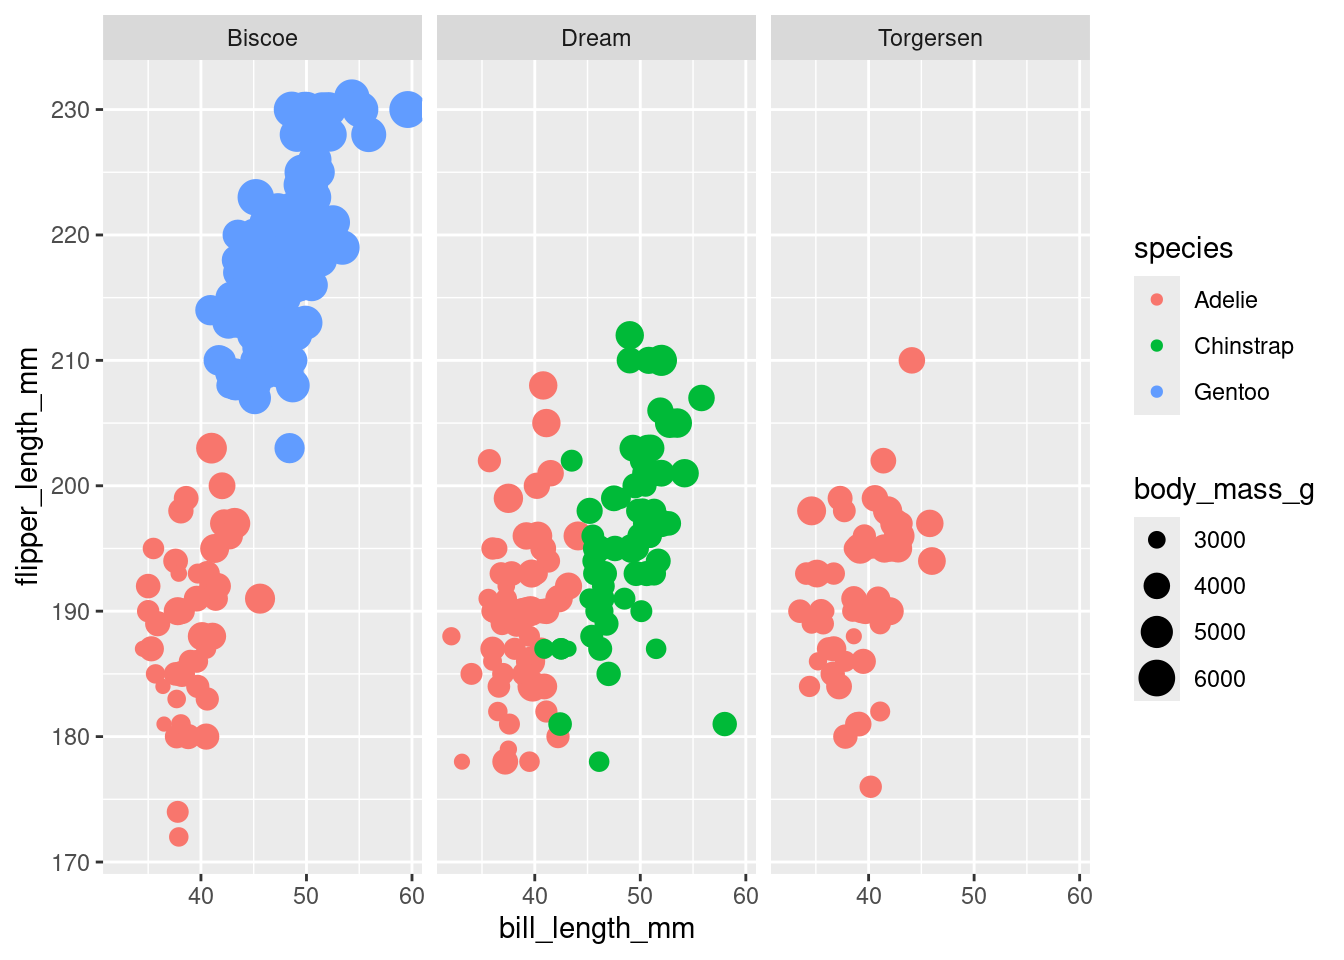
Explore how using different geom’s to represent the same variable can affect the quality of a data visualization by creating two new versions of Figure 6. Your first new version should use the shape aesthetic to represent the island variable, and your second new version should use the size aesthetic to represent the island variable. After creating these two new versions, explain which of the three (the original Figure 6 and the two new version) you prefer the most and which of the three you least prefer.
Warning: Removed 2 rows containing missing values or values outside the scale range
(`geom_point()`).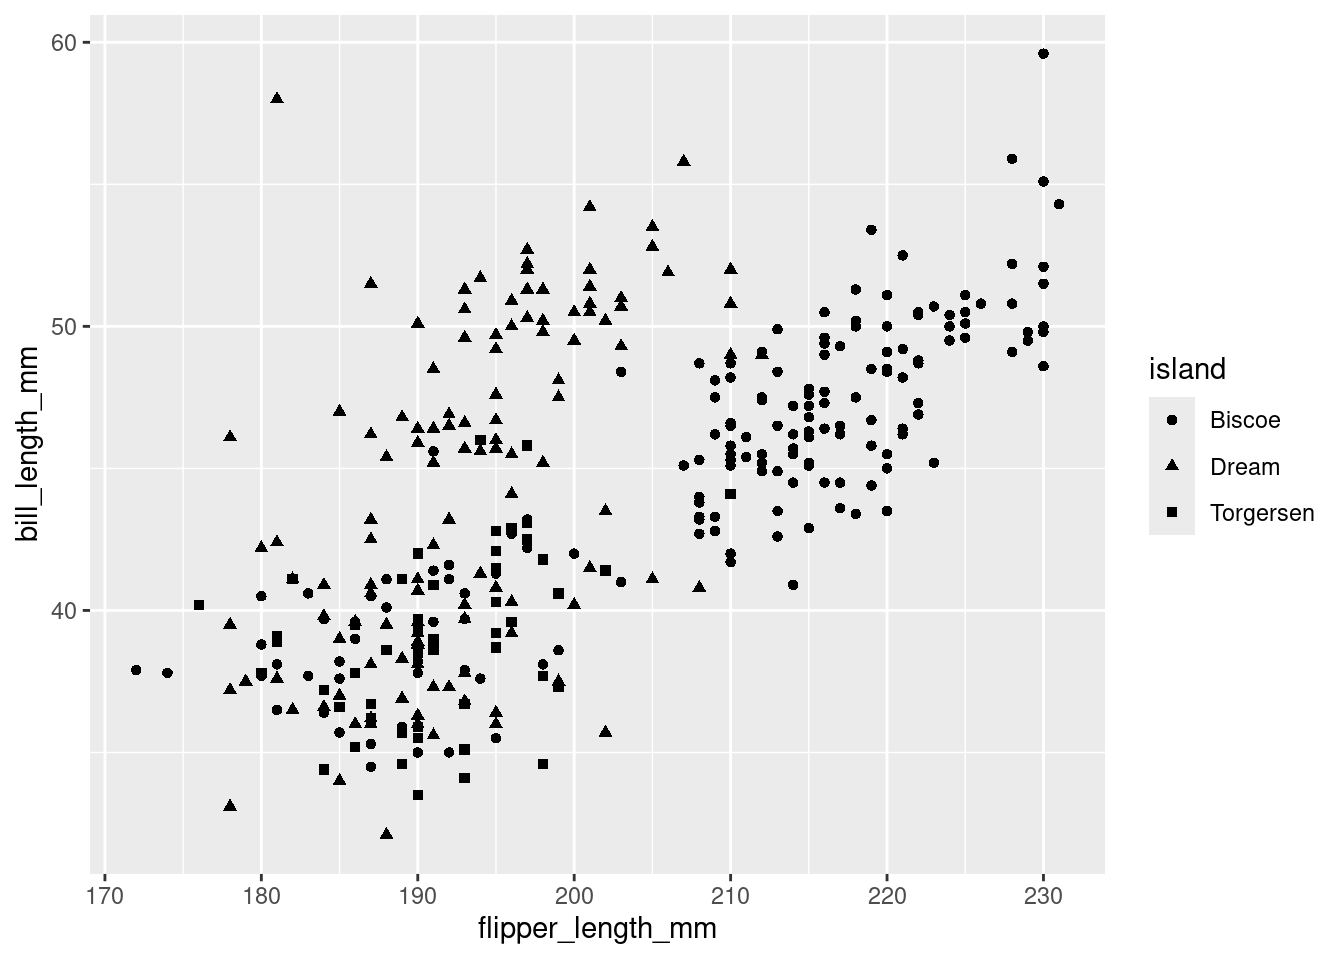
Warning: Using size for a discrete variable is not advised.
Removed 2 rows containing missing values or values outside the scale range
(`geom_point()`).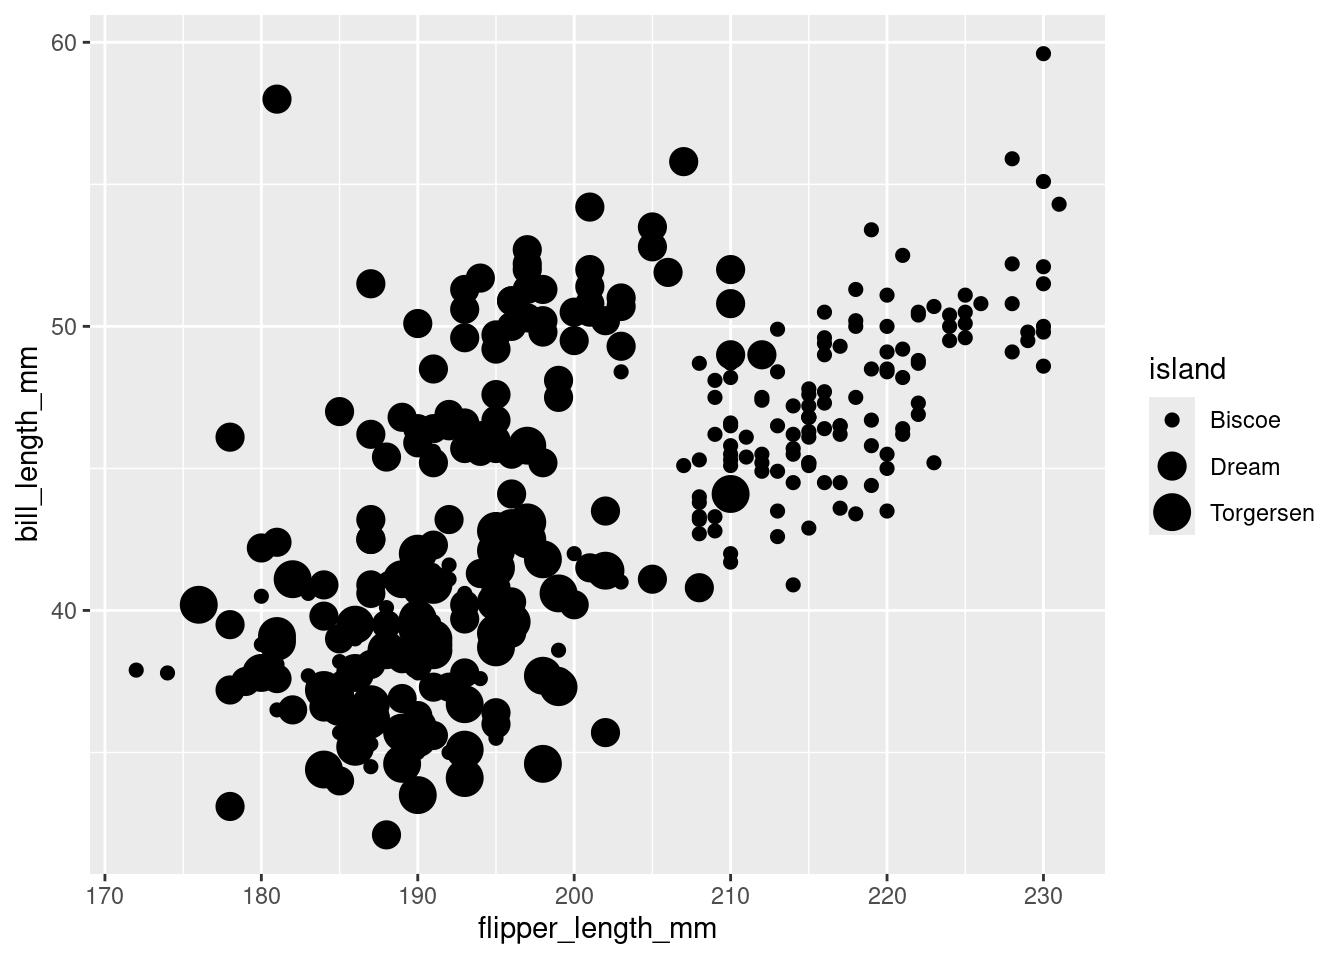
The original version that uses color is preferable, because the contrast between the different islands is high; it’s easy to discriminate two observations from different islands because the difference in color is easily noticeable.
The version that uses size is the least preferable, because the observations from Torgersen island (which gets assigned the largest dots) are so large they overlap and obscure nearby points, and it’s hard to tell Togersen island apart from Dream island.
Question
Use ggplot2 to create a plot that looks like Figure 7.