| department | week1_order |
|---|---|
| Accounting | 1 |
| Human Resources | 2 |
| Marketing | 3 |
| Operations | 4 |
Lab 10: Referencing Figures and Tables
Question
Imagine that you are the CEO of a large multinational corporation, and that each week you receive update presentations from the major departments in your corporation. You wish to write an email to the head of each department, letting them know the order of the presentations for next week’s meeting, and you want to include the following table in your email:
Recreate this table as a data frame in , and then display this data frame as a formatted table.
Don’t forget about loading the packages you need!
Question
As shown in the table above, the department heads are scheduled to give their presentations in alphabetical order by department name.
Create a random presentation schedule for the next two weeks by using the sample() function to shuffle the values in the week1_order column. Be sure to create a new column in the data frame for each new presentation order.
When you’re finished creating the presentation schedules, be sure to display this updated data frame as a formatted table
| department | week1_order | week2_order | week3_order |
|---|---|---|---|
| Accounting | 1 | 3 | 2 |
| Human Resources | 2 | 1 | 3 |
| Marketing | 3 | 4 | 4 |
| Operations | 4 | 2 | 1 |
Question
The code below counts the number of four, six, and eight cylinder cars represented in the mtcars data set.
Augment this summary table by adding a new column that measures the percentage of four, six, and eight cylinder cars, and by formatting the final table using the kable() function.
Be sure that your summary table uses reader-friendly names (e.g., “Cylinder” instead of “cyl”), and that all values are rounded to two decimal points. There are many ways to do this, but kable() already includes such functionality. Read the help page for the kable() function to find out the best way to do this. Don’t forget that you can open the help page by running ?kable in the R console.
Lastly, write a sentence describing what the reader can learn from this table, and cross-reference this table in your writing.
| Cylinders | Count | Percentage |
|---|---|---|
| 4 | 11 | 34.38 |
| 6 | 7 | 21.88 |
| 8 | 14 | 43.75 |
Table 1 shows us that the majority of cars in the mtcars data set have eight cylinder engines
Question
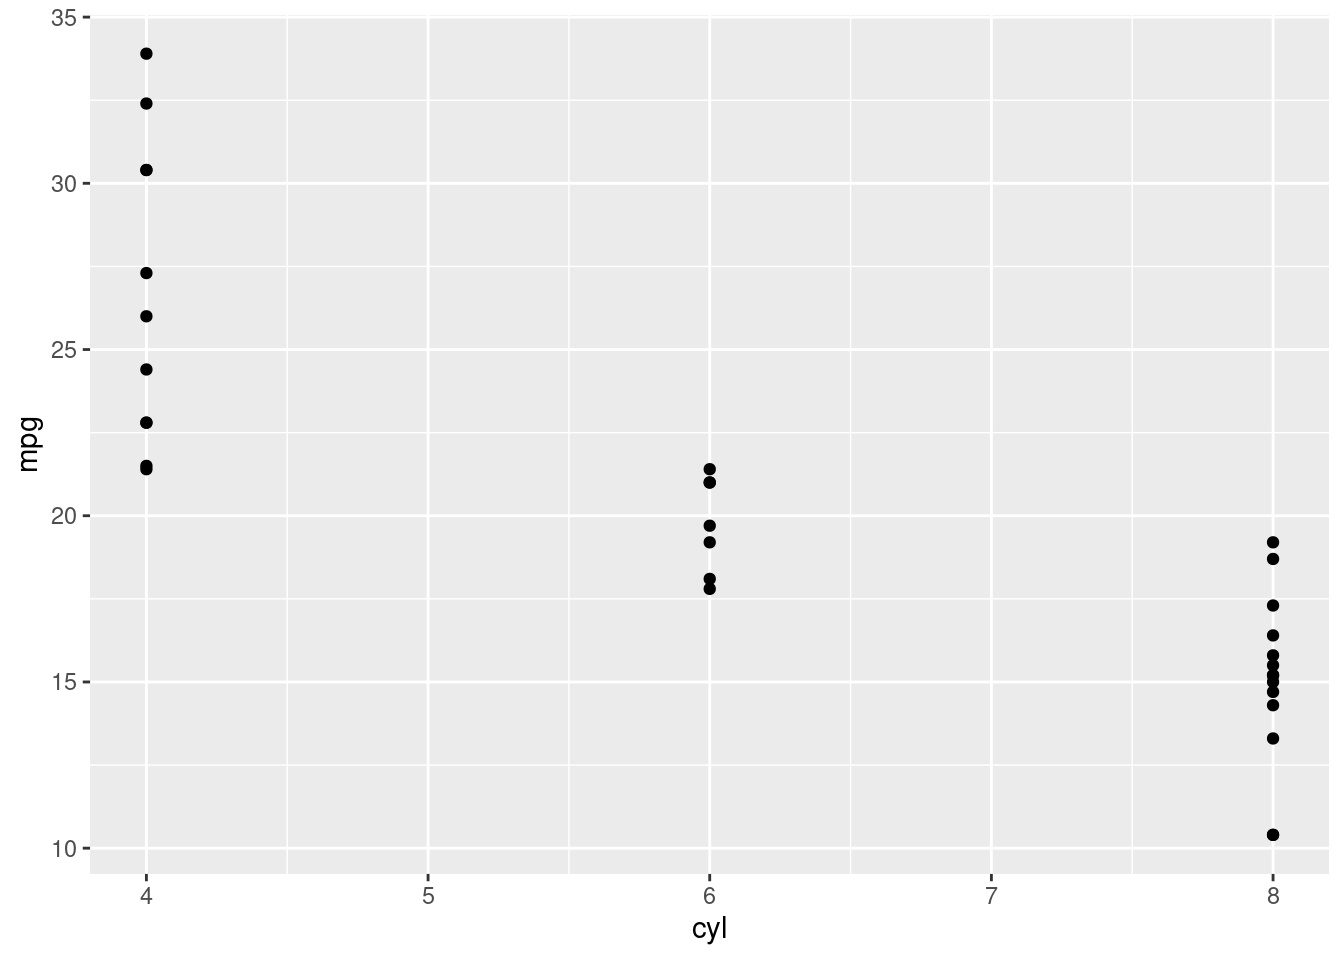
Create a scatterplot visualizing the relationship between the cyl and mpg variables in the mtcars data set. Write a sentence summarizing what can be learned from this figure, and cross-reference this figure in your writing.

Figure 1 shows us there is a negative relationship between the number of cylinders a car’s engine has and the cars gas mileage.
Question
Embed and cross-reference this animation of a horse’s gallop1.

Figure 2 shows the “Horse In Motion” animation, which is the earliest known motion picture based on real photographic images.
Footnotes
“The Horse In Motion” is the earliest known motion picture based on real photographic images, and the history behind this image is quite interesting!↩︎